

The Fault in Our PE Ratio
The fallacy of using PE based pricing to value stocks in times of falling interest rates

Hopefully, the snappy title is effective in catching your eye to yet another post about the stock markets. So, let’s get right into this one.

Today, we’re going to try and make sense of the PE ratio and why it may be slightly irrelevant in today’s times, where central banks all around the world, are lowering interest rates.
Pricing VS Valuing stocks
The first and foremost difference to know about, is the difference in pricing and valuing of companies.
Pricing refers to assigning a valuation multiple to a company’s earnings or sales or EBIT or EBITDA or even “Community adjusted EBITDA”, in case you are WeWork. This valuation multiple that is assigned, is based on either the company’s share price over the history or an industry-wide multiple or so on. This is how the Price to Earnings, aka, PE ratio works.
PE Ratio is simply the number of times the current earnings, that you would pay for a company. Pretty standard math, here.

Let’s take a company that deals with paper and paper products. Let’s call it Dunder Mifflin, because, why not? Over the past 20 years of being listed, the company has traded in a PE ratio range of 20 - 30.
If a competitor, say Staples, is available today for a PE ratio of 15 would you buy it, since it is undervalued?
Well, not exactly.
This is because of differences in the growth rate, dividend policies, market leadership position, quality of top management (Michael Scott for Dunder Mifflin, duh!), etc between the two companies.
However, there is one drawback with the PE ratio. The market price, that is the numerator for the PE formula, was determined by the market participants themselves. You’re basically leaving the valuation process to the markets, and indirectly assuming the markets are efficient.
Well, I do NOT believe in the efficient markets hypothesis at all. As the most recent example of this, have a read about how the markets rewarded the wrong Zoom Technologies, when video conferencing started picking up, during the Covid period.
Well, here’s where valuation or intrinsic valuation comes into the picture.
Intrinsic Valuation is a more raw form of valuation, that does not factor in market price of the company in its process at all. The most common method used is the Discounted Cashflow Model (DCF), wherein you estimate the future cashflows (not accounting profits. I repeat. NOT ACCOUNTING PROFITS) of a company and discount them to the current date, using an appropriate discount rate to arrive at a value for the company. Since the process does not require stock prices, it can be applied to the unlisted players as well.
While the math involved isn’t too difficult to grasp here, it could be intimidating for someone who’s new to this.
One major thing to understand here, is lower the interest rate, higher is the value of a company, and vice versa.

Okay, Michael. We feel you.
Let’s try to get a sense of it using a simple example of Fixed Deposits.
Suppose, you would like to earn an income of 60,000 each year from a risk free investment. The FD rate offered by SBI is, say, 6%. So, naturally, you would have to make an FD for a principal amount of 10,00,000. Now, assume, the interest rates offered, were 4%. The amount needed to earn 60,000 at 4% interest is 15,00,000 (60,000/4%).
The value of investment to be made today, goes up in case the interest rates fall.
And.
That’s it. You’re now all equipped to understand the interplay between the PE ratio and DCF now.

Let us take 2 examples, to understand this concept.
The following basic fundamentals, would remain same across both the instances.

Case 1: High Risk Free Interest Rate
We have assumed a Risk Free Interest Rate (RFR) of 6% in our valuation. Now, another point to know here is, the discount rate for valuation of equities (cost of equity) is directly proportional to the RFR.
Here’s the cost of equity using the CAPM model here:
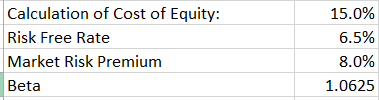
And, here is the result of running a 10 year DCF on the basis of the above details:
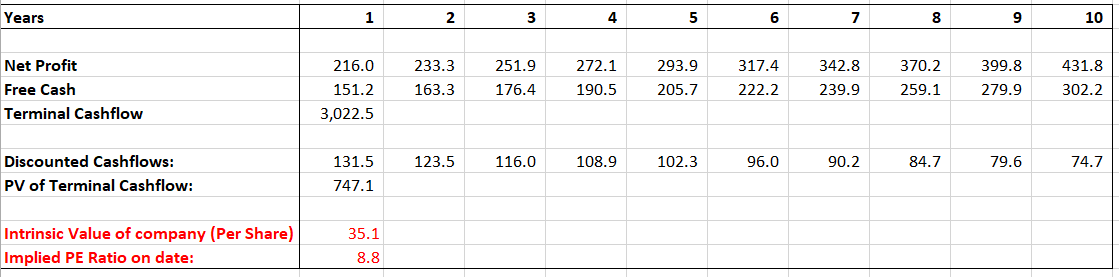
As you see, the intrinsic value is 35/ share. At an EPS of 4, the PE ratio comes to 8.8 times. Here, of course, we are using the intrinsic value of company to calculate PE ratio.
(Also, I am not be getting into the calculation details and formulas for terminal cashflow. I’m assuming you trust me with the math after my rant on the GDP numbers :p)
Case 2: Low Risk Free Interest Rate
In case 2, we have assumed a lower RFR of 4% in our valuation. Here’s the cost of equity using the CAPM model here:

And, here is the changes in intrinsic value of the company.

As explained with FDs, the value of the company has increased (from 35/share to 47/share. This has led to a higher implied PE ratio as well, based on the intrinsic value (from 8.8x to 11.8x).
No changes in the fundamental assumptions about the company in the two examples, but still, there is a change in the valuation, due to the change in the economic environment of lower interest rates.
Let’s correlate this example with the actual markets now.
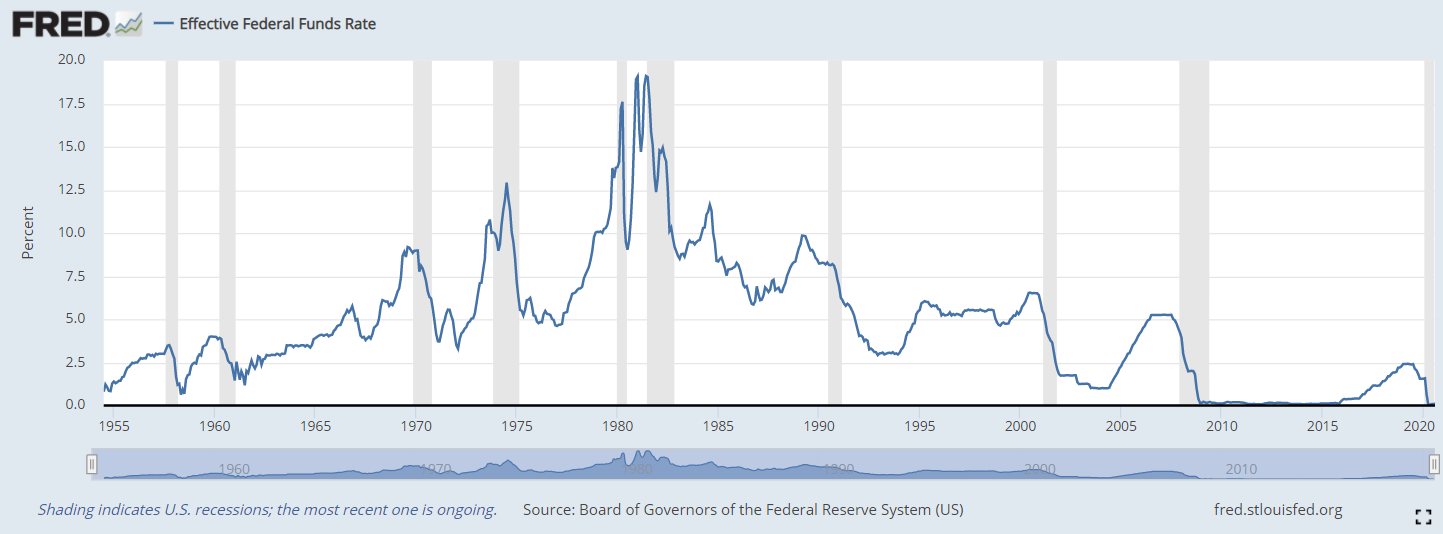
As mentioned at the beginning about Central Bank actions, interest rates in the US are near 0 and have probably never been lower than they are now.
Similar is the case for India:

With various countries having even negative interest rates, the condition is new and never seen before.
And what is this situation doing for the PE ratios?

We have been moving up and making new all time highs, when it comes to the PE ratio for the Nifty index. Now is this all only because of lower interest rates? Probably not. But it is definitely a contributing factor, to say the least.
Of course, I would not want to be timing the markets and have no comments in relation to the overvaluation or undervaluation of the markets at this point of time, however, it is worth noting that we are probably in a period of radical change, in relation to the capital markets and returns, as well.
Very well explained!